What QR Code Scan Analytics Really Tell You (and What They Don't)
Scan data is genuinely useful and easy to over-read. Here is what the numbers mean, and the conclusions people jump to that the data doesn't support.
The MyPersonalQR team2 min read · 27 August 2025 · Analytics
The first time you see your scan numbers it is a thrill. Print has always been invisible, and now it isn't.
Then a spike appears, and you start building a story around it. It must be the new poster. It must be the weather. It must be the campaign.
Scan analytics are worth having. They are also narrower than they look, and knowing where the edges are makes them far more useful.
A scan is a request. It is not a person.
What you actually get
A scan is a request, so anything visible in a normal web request is available, and nothing else.
- How many scans, and when
- Country and city, approximately
- Device, operating system and browser
- Which page was served, if you use scheduling
Time of day is the most useful number
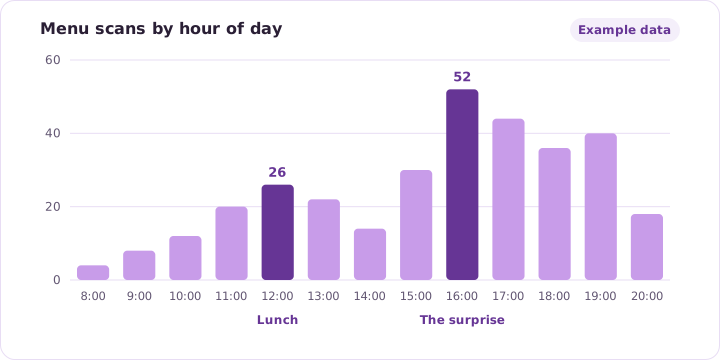
Totals feel important and rarely change a decision. The shape across the day usually does.
A restaurant that assumes lunch is its busy period, and finds the menu gets opened twice as often at four in the afternoon, has learned something it can act on.
- Find the hours that really matter
- See which days carry the week
- Spot a campaign peaking and fading
- Compare a quiet site against a busy one
Location is rougher than it looks
Location comes from the network the phone is on, not from GPS. On mobile data it can show wherever the network routes through, which is sometimes a city nobody in your story ever visited.
Treat it as a broad signal. It is useful for confirming your customers are mostly local, and not much use for anything finer than that.
One scan is not one person
One person scanning three times is three scans. A code scanned by somebody testing it is a scan. A phone that reads the code without anybody opening the page may still count.
So scan counts are best read as a relative measure. This placement against that one, this week against last week. The absolute number matters less than the comparison.
The comparison is where the value is
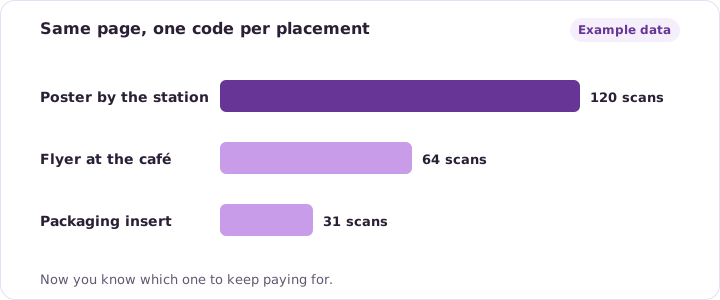
One code with a big number tells you very little on its own. Two codes doing the same job in different places tell you which one to keep paying for.
That is the one habit worth building. Split by placement from the start, because you can't separate the data afterwards.
- One code per poster site
- Separate codes for packaging and shelf edge
- A different code for each event
- Keep last year's code so you can compare
See how this applies to Marketing Teams.
Try it on a code of your own. It takes a few minutes.